


This article shows you how to draw some simple bar charts in Flutter with fl_chart, one of the most popular chart plugins these days.
Installation
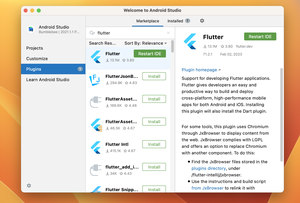
1. Install the latest version of fl_chart by running the command below:
flutter pub add fl_chart2. Then execute this:
flutter pub getExamples
Don’t forget to import fl_chart:
import 'package:fl_chart/fl_chart.dart';Example 1: The simplest bar chart
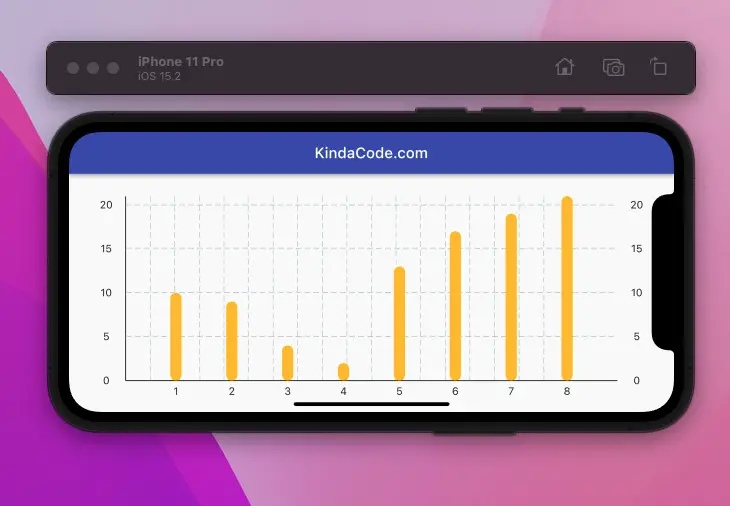
This example creates the simplest bar chart. For simplicity’s sake, we’ll hard code the input data.
The code:
import 'package:flutter/material.dart';

// import fl_chart
import 'package:fl_chart/fl_chart.dart';

void main() {
  runApp(const MyApp());
}

class MyApp extends StatelessWidget {
  const MyApp({super.key});
  @override
  Widget build(BuildContext context) {
    return MaterialApp(
      // hide the debug banner
      debugShowCheckedModeBanner: false,
      title: 'KindaCode.com',
      theme: ThemeData(
        primarySwatch: Colors.blue,
      ),
      home: const MyHomePage(),
    );
  }
}

class MyHomePage extends StatelessWidget {
  const MyHomePage({super.key});

  @override
  Widget build(BuildContext context) {
    return Scaffold(
      appBar: AppBar(
        title: const Text('KindaCode.com'),
      ),
      body: Padding(
        padding: const EdgeInsets.all(30),
        // implement the bar chart
        child: BarChart(BarChartData(
            borderData: FlBorderData(
                border: const Border(
              top: BorderSide.none,
              right: BorderSide.none,
              left: BorderSide(width: 1),
              bottom: BorderSide(width: 1),
            )),
            groupsSpace: 10,

            // add bars
            barGroups: [
              BarChartGroupData(x: 1, barRods: [
                BarChartRodData(toY: 10, width: 15, color: Colors.amber),
              ]),
              BarChartGroupData(x: 2, barRods: [
                BarChartRodData(toY: 9, width: 15, color: Colors.amber),
              ]),
              BarChartGroupData(x: 3, barRods: [
                BarChartRodData(toY: 4, width: 15, color: Colors.amber),
              ]),
              BarChartGroupData(x: 4, barRods: [
                BarChartRodData(toY: 2, width: 15, color: Colors.amber),
              ]),
              BarChartGroupData(x: 5, barRods: [
                BarChartRodData(toY: 13, width: 15, color: Colors.amber),
              ]),
              BarChartGroupData(x: 6, barRods: [
                BarChartRodData(toY: 17, width: 15, color: Colors.amber),
              ]),
              BarChartGroupData(x: 7, barRods: [
                BarChartRodData(toY: 19, width: 15, color: Colors.amber),
              ]),
              BarChartGroupData(x: 8, barRods: [
                BarChartRodData(toY: 21, width: 15, color: Colors.amber),
              ]),
            ])),
      ),
    );
  }
}
Screenshot:
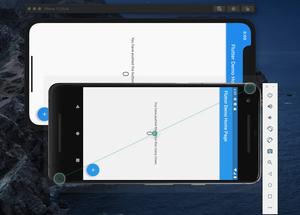
Example 2: Bar Chart with Dynamic Data
This example displays a bar chart with dynamic contents.
App preview:
The complete code with explanations:
// main.dart
import 'package:flutter/material.dart';
import 'dart:math';

import 'package:fl_chart/fl_chart.dart';

void main() {
  runApp(const MyApp());
}

class MyApp extends StatelessWidget {
  const MyApp({Key? key}) : super(key: key);

  @override
  Widget build(BuildContext context) {
    return MaterialApp(
      debugShowCheckedModeBanner: false,
      title: 'KindaCode.com',
      theme: ThemeData(
        primarySwatch: Colors.indigo,
      ),
      home: HomePage(),
    );
  }
}

// Define data structure for a bar group
class DataItem {
  int x;
  double y1;
  double y2;
  double y3;
  DataItem(
      {required this.x, required this.y1, required this.y2, required this.y3});
}

class HomePage extends StatelessWidget {
  HomePage({Key? key}) : super(key: key);

  // Generate dummy data to feed the chart
  final List<DataItem> _myData = List.generate(
      30,
      (index) => DataItem(
            x: index,
            y1: Random().nextInt(20) + Random().nextDouble(),
            y2: Random().nextInt(20) + Random().nextDouble(),
            y3: Random().nextInt(20) + Random().nextDouble(),
          ));

  @override
  Widget build(BuildContext context) {
    return Scaffold(
      appBar: AppBar(
        title: const Text('KindaCode.com'),
      ),
      body: Padding(
        padding: const EdgeInsets.all(20),
        child: SingleChildScrollView(
          scrollDirection: Axis.horizontal,
          child: SizedBox(
            width: 3000,
            child: BarChart(BarChartData(
                borderData: FlBorderData(
                    border: const Border(
                  top: BorderSide.none,
                  right: BorderSide.none,
                  left: BorderSide(width: 1),
                  bottom: BorderSide(width: 1),
                )),
                groupsSpace: 10,
                barGroups: _myData
                    .map((dataItem) =>
                        BarChartGroupData(x: dataItem.x, barRods: [
                          BarChartRodData(
                              toY: dataItem.y1, width: 15, color: Colors.amber),
                          BarChartRodData(
                              toY: dataItem.y2, width: 15, color: Colors.red),
                          BarChartRodData(
                              toY: dataItem.y3, width: 15, color: Colors.blue),
                        ]))
                    .toList())),
          ),
        ),
      ),
    );
  }
}
Conclusion
We’ve walked through a few examples of implementing beautiful and meaningful bar charts in Flutter applications with the help of the fl_chart plugin. If you’d like to learn more new and interesting things about the modern Flutter world, take a look at the following articles:
- Flutter: SliverGrid example
- Using Chip widget in Flutter: Tutorial & Examples
- Flutter: ListView Pagination (Load More) example
- Flutter & Hive Database: CRUD Example
- Flutter & SQLite: CRUD Example
- Using GetX (Get) for State Management in Flutter
You can also take a tour around our Flutter topic page and Dart topic page to see the latest tutorials and examples.