


Charts are a visual tool to represent data, making it easier for users to grasp information than dry numbers. There’re several plugins that can help us easily make circle charts (pie charts) in Flutter. In this tutorial, we’ll use fl_chart, one of the most popular chart plugins on pub.dev.
Installing the plugin
1. Add the package name to the dependencies section in your pubspec.yaml by executing this:
flutter pub add fl_chart2. Next, run the following command :
flutter pub get3. Import the plugin into your project:
import 'package:fl_chart/fl_chart.dart';Examples
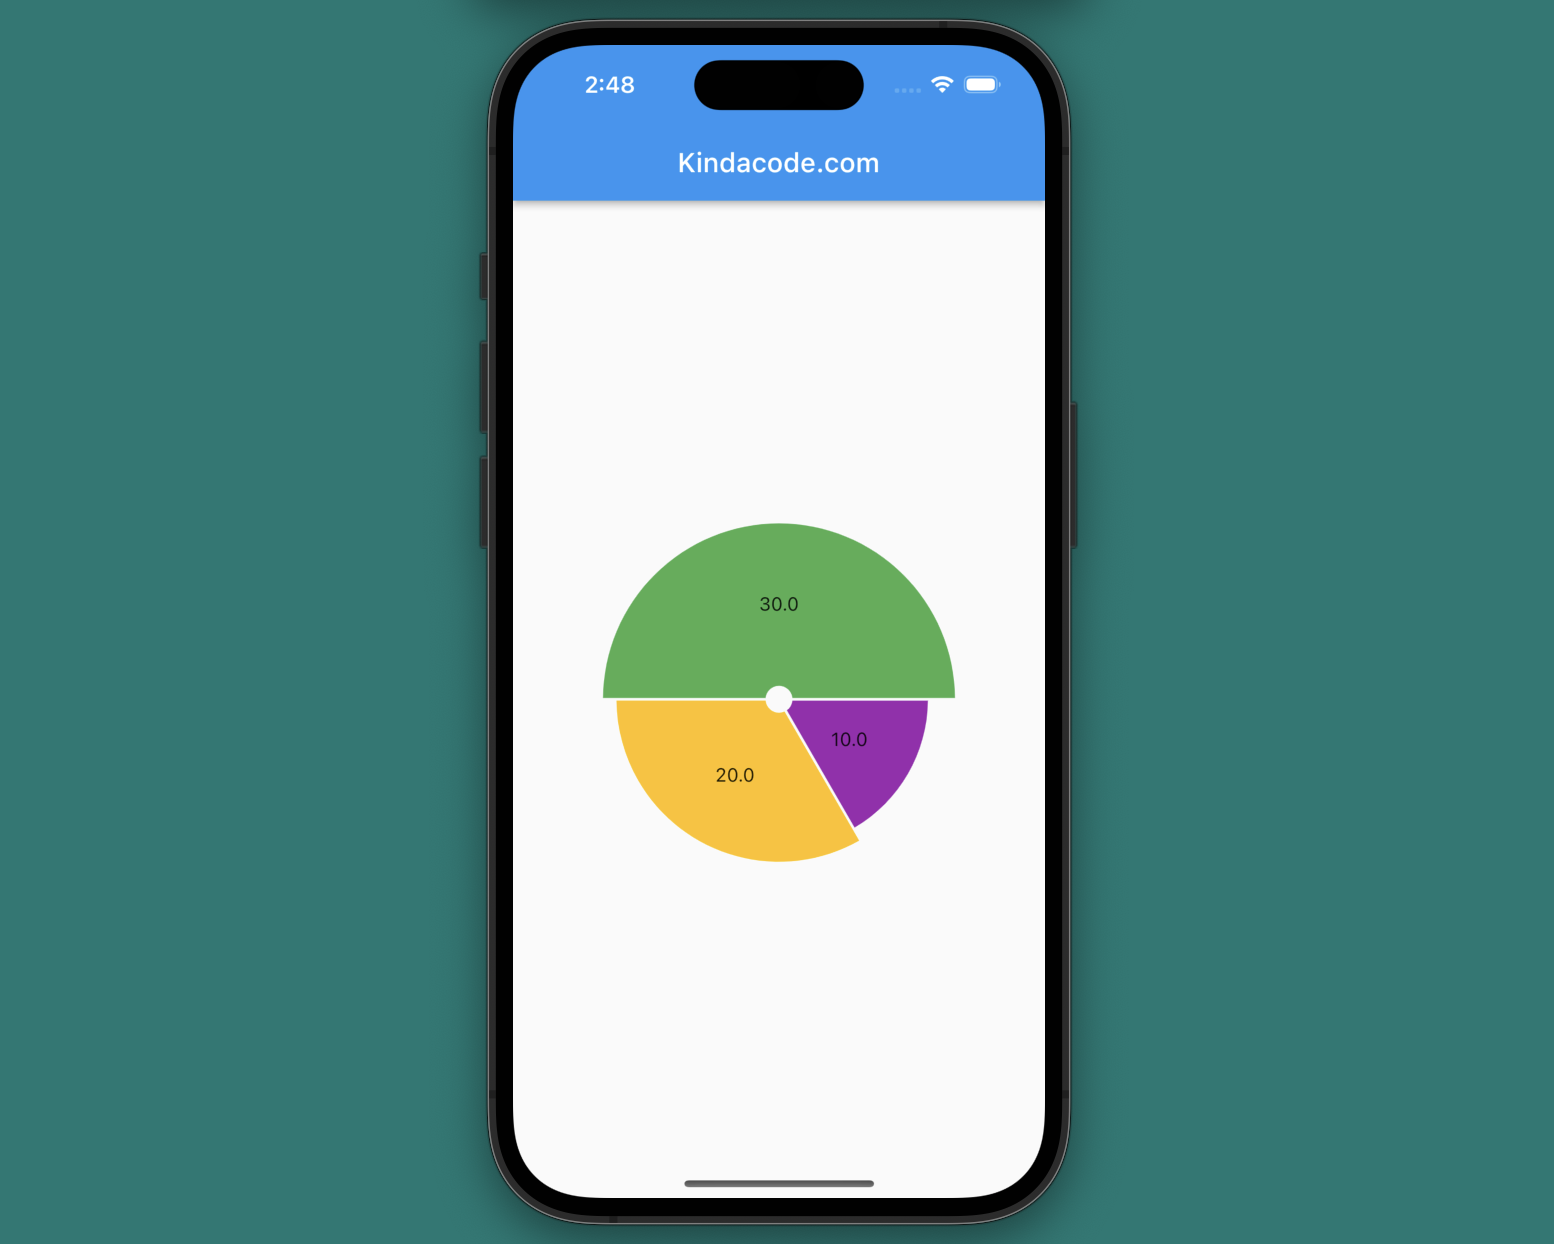
A Standard Pie Chart
Screenshot:
The code:
Scaffold(
appBar: AppBar(title: const Text('Kindacode.com')),
body: Center(
child: PieChart(PieChartData(
centerSpaceRadius: 10,
borderData: FlBorderData(show: false),
sections: [
PieChartSectionData(value: 10, color: Colors.purple, radius: 100),
PieChartSectionData(value: 20, color: Colors.amber, radius: 110),
PieChartSectionData(value: 30, color: Colors.green, radius: 120)
])),
),
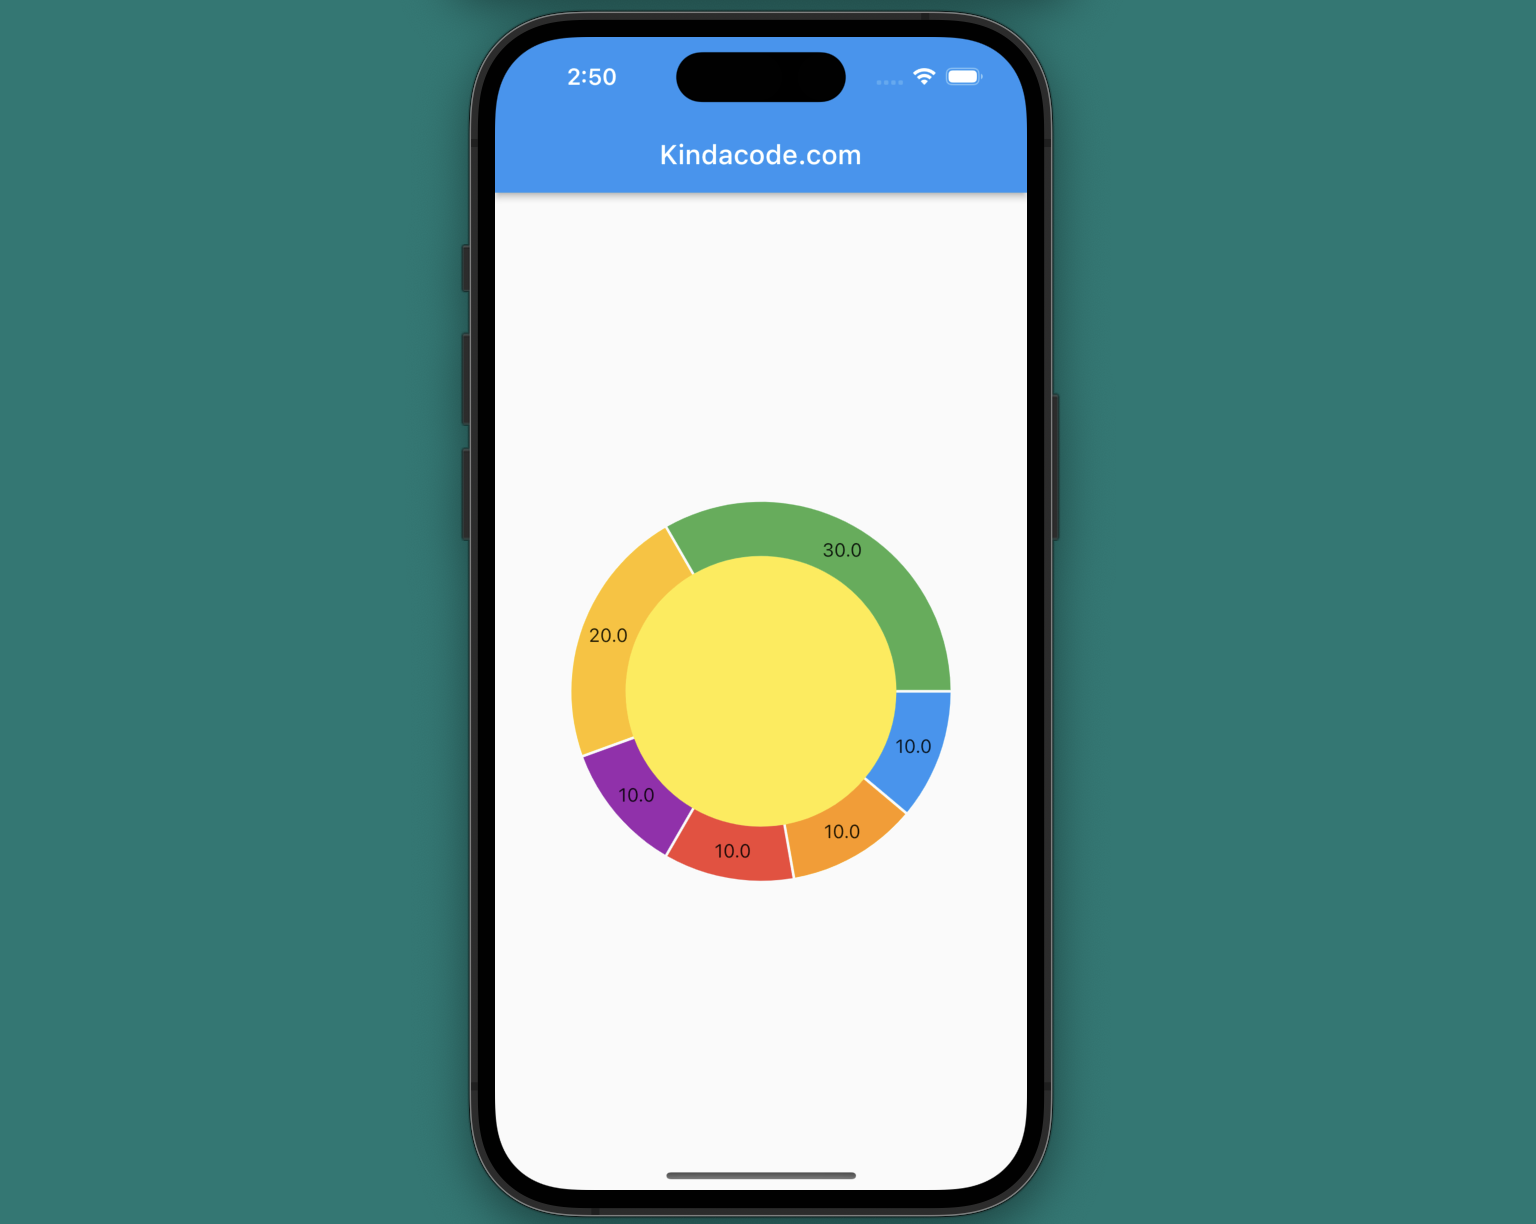
);Doughnut Chart
This example creates a doughnut chart. This name can make you get confused, but it is simply a pie chart with a big hole in the middle.
Screenshot:
The code:
Scaffold(
      appBar: AppBar(title: const Text('Kindacode.com')),
      body: Center(
        child: PieChart(PieChartData(
            centerSpaceRadius: 100,
            centerSpaceColor: Colors.yellow,
            borderData: FlBorderData(show: false),
            sections: [
              PieChartSectionData(value: 10, color: Colors.blue),
              PieChartSectionData(value: 10, color: Colors.orange),
              PieChartSectionData(value: 10, color: Colors.red),
              PieChartSectionData(value: 10, color: Colors.purple),
              PieChartSectionData(value: 20, color: Colors.amber),
              PieChartSectionData(value: 30, color: Colors.green)
            ])),
      ),
);
Conclusion
We’ve gone through a few examples of implementing pie charts in mobile applications. If you’d like to learn more new and interesting things in Flutter, take a look at the following articles:
- How to draw Bar Charts with fl_chart in Flutter
- How to Create a Sortable ListView in Flutter
- Using Chip widget in Flutter: Tutorial & Examples
- Flutter PaginatedDataTable Example
- Flutter & Hive Database: CRUD Example
- Example of sortable DataTable in Flutter
You can also take a tour around our Flutter topic page and Dart topic page to see the latest tutorials and examples.