


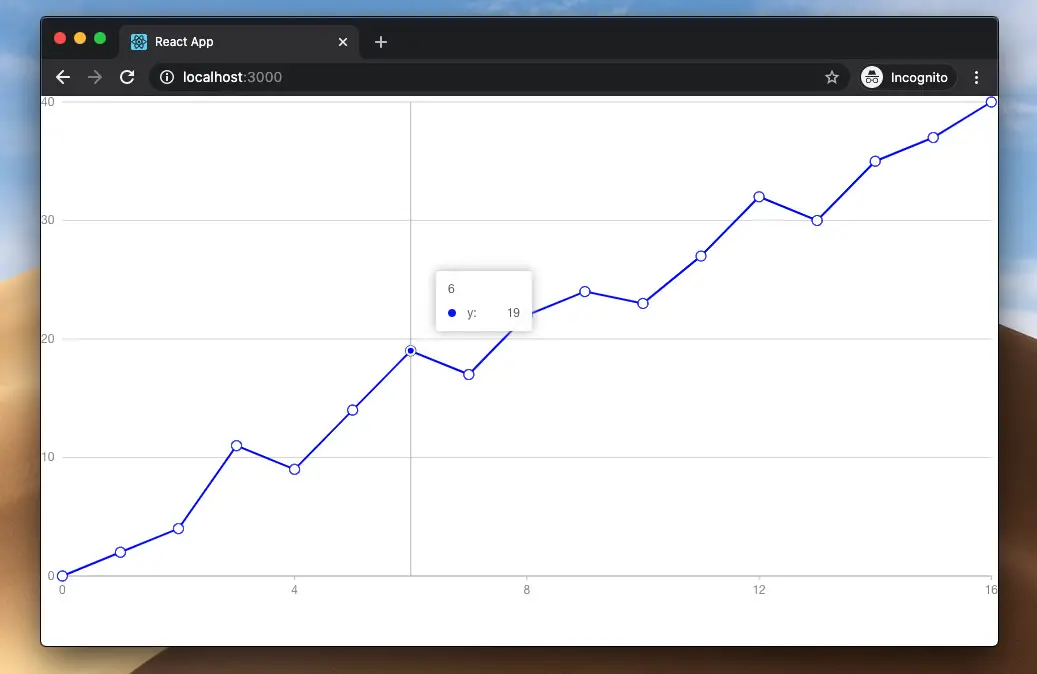
This article shows you how to draw a simple line chart in React with the help of the Ant Design Chart library.
1. Installing the package:
npm install @ant-design/charts2. Implementing the line chart in React code:
import React from 'react';
import { Line } from '@ant-design/charts';

const App = () => {
  // Generating some dummy data
  const myData = [
    { x: 0, y: 0 },
    { x: 1, y: 2 },
    { x: 2, y: 4 },
    { x: 3, y: 11 },
    { x: 4, y: 9 },
    { x: 5, y: 14 },
    { x: 6, y: 19 },
    { x: 7, y: 17 },
    { x: 8, y: 22 },
    { x: 9, y: 24 },
    { x: 10, y: 23 },
    { x: 11, y: 27 },
    { x: 12, y: 32 },
    { x: 13, y: 30 },
    { x: 14, y: 35 },
    { x: 15, y: 37 },
    { x: 16, y: 40 },
  ];

  return (
    <>
      <Line
        data={myData}
        height={500}
        xField="x"
        yField="y"
        point={{ size: 5, shape: 'diamon' }}
        color='blue'
      />
    </>
  );
};

export default App;
You can find more detailed information and advanced uses of Ant Desing Charts here.
Continue learning more about modern React by taking a look at the following articles:
- React + TypeScript: Working with Props and Types of Props
- React: Show Image Preview before Uploading
- React: How to Upload Multiple Files with Axios
- React: Making a side Drawer with Ant Design
- Most popular React Component UI Libraries
- Top 4 best React form validation libraries
You can also check our React topic page and React Native topic page for the latest tutorials and examples.